Viz Makeover
With the release of Tableau 8, there are a host of new features including brand-new visualizations. I took one of my old visualizations and revamped it with things you can only do in version 8.
Here's a summary of the things I changed from my original U.S. Unemployment Rate Viz:
Here's a summary of the things I changed from my original U.S. Unemployment Rate Viz:
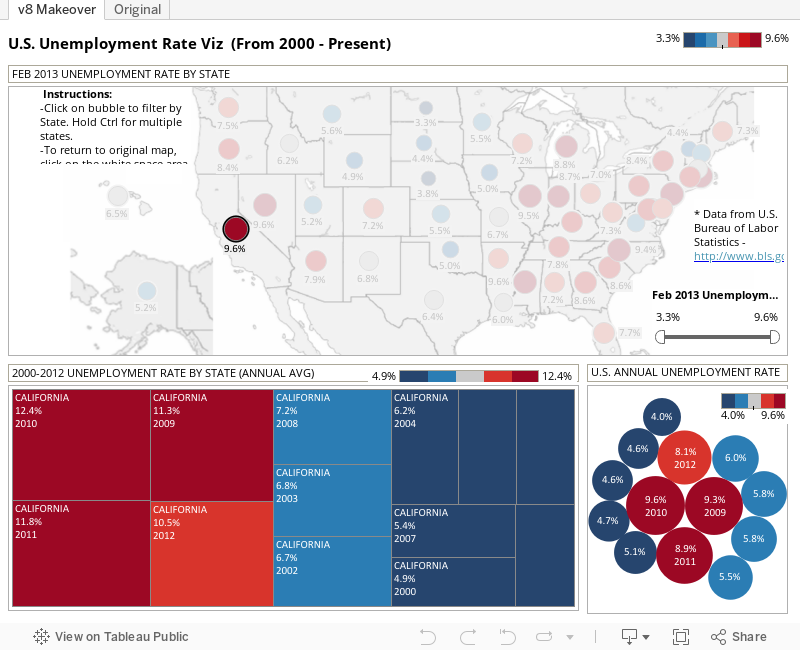
- Decided to pull the latest unemployment data from the U.S. Bureau of Labor Statistics (data is up to Feb 2013).
- Utilized a treemap to show the Unemployment Rate % by state (from 2000-2012). Treemaps are an effective way to show many slices of information!
- Tried using the new packed bubbles visualization to display the U.S. annual unemployment rate (avg) from 2000-2012. It's a catchy way to show information although it can be a bit tricky to use since it may or may not be more effective than your standard bar chart. I'll let you decide. :)
- Floating containers everywhere! Added text to guide the user on how to use the map as a filter, put color legends closer to the visualizations, and put the slider for Feb 2013 Unemployment Rate % closer to the map itself. It's really nice to not have to line up all the filters/legends on the right side.
- Kept the colors consistent on each visualization - using the Red-Blue diverging theme. With the ability to put color legends anywhere on the dashboard, it makes it much easier to see which legend corresponds to which visualization.
- Adding multiple labels to visualizations like on the treemap. It's so helpful to not be restricted to just one label like before. You can add as many labels as you want! And Tableau is smart enough to know how much to display depending on your screen size.
There are so many more features in Tableau 8. It's definitely worth taking a look. One great new feature I need to learn more about is the Javascript API. It's going to allow people to really be creative! The possibilities are endless! Can't wait to see what others create using this new API.
What a fantastic read on Tableau. This has helped me understand a lot in Tableau course. Please keep sharing similar write ups on Tableau. Guys if you are keen to knw more on Tableau, must check this wonderful Tableau tutorial and i'm sure you will enjoy learning on Tableau training.
ReplyDeletehttps://www.youtube.com/watch?v=AyzIchw2Lik