Posts

Showing posts from 2014

Destination Data

Image
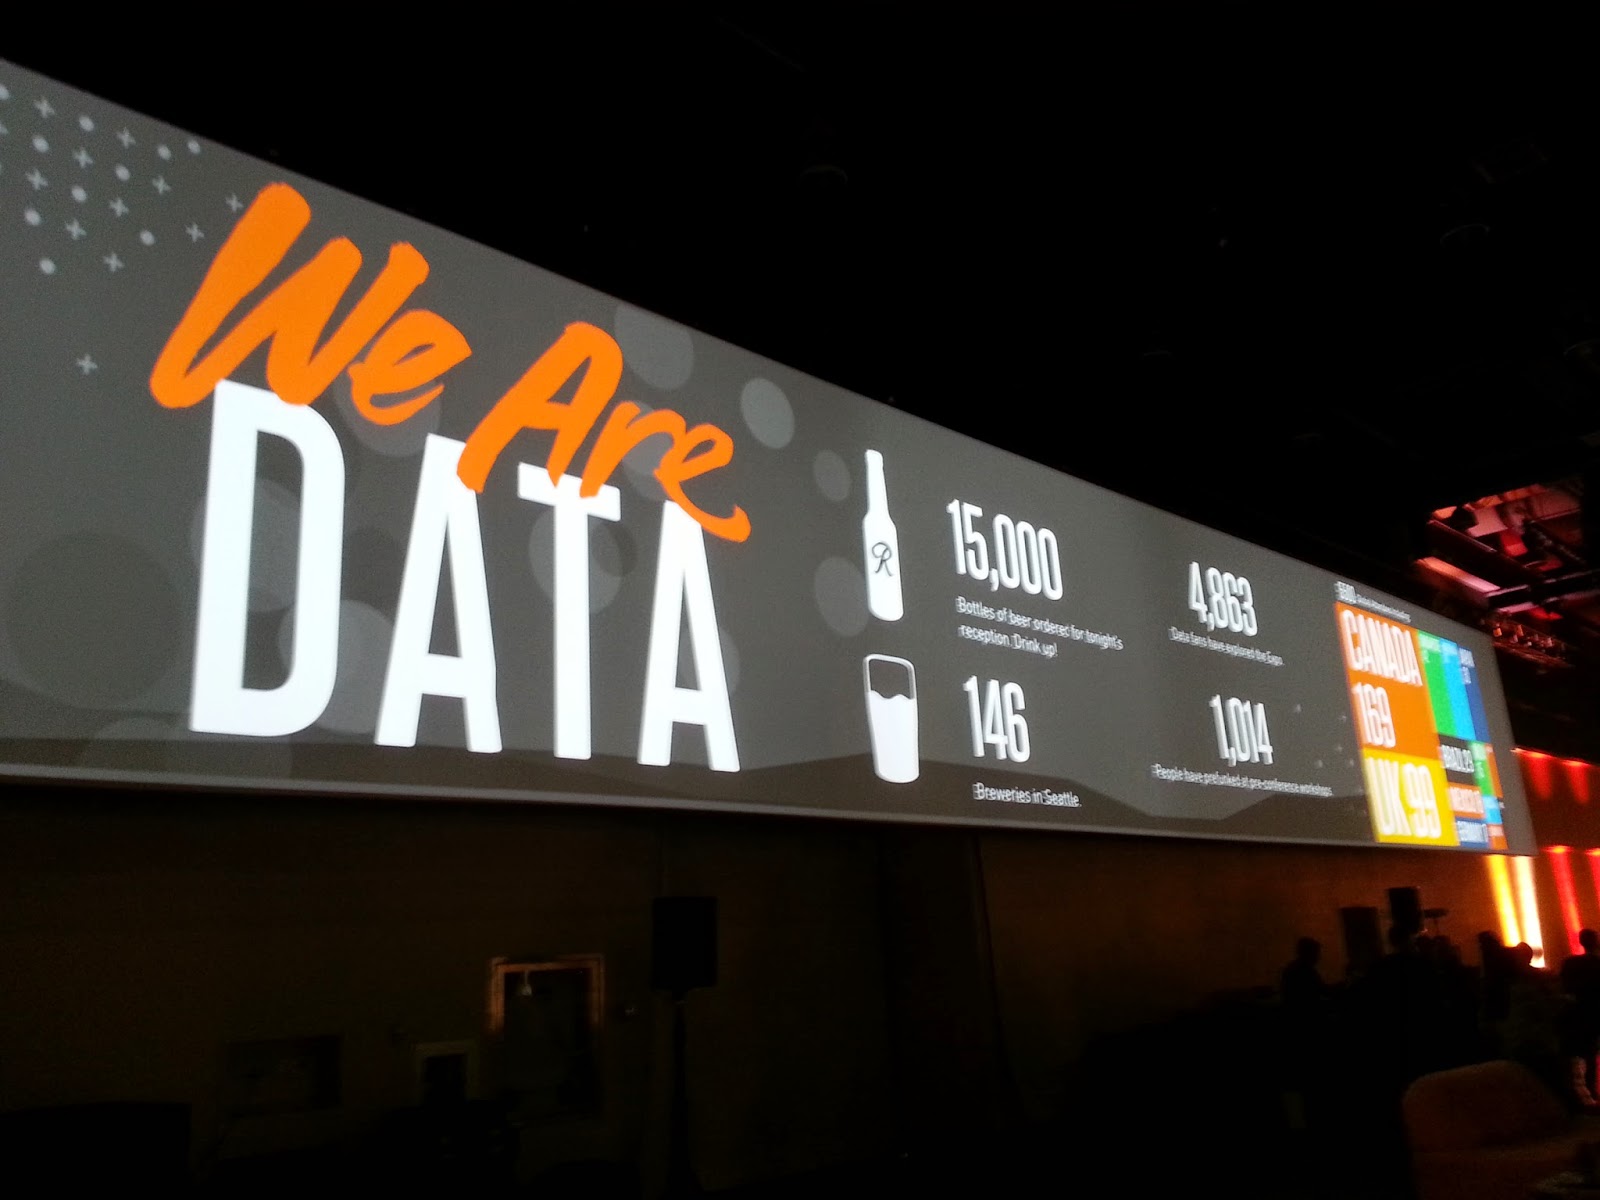
Having just returned from the 2014 Tableau Conference , I was debating whether or not I should blog about it. I realized I've received so much from the Tableau Community over the years that it would be a shame to not share my thoughts. So, here we go ... TABLEAU CONFERENCE IS BIG! One thought that definitely stuck out was the sheer size of this year's conference! There were 5,500 attendees so it was definitely crowded at times. But it was a reminder of the incredible growth that Tableau has been experiencing and how, so many others have found Tableau to be a tool that not only gets the job done, yet also delights. I like how one person said that Tableau is the closest thing he's found to playing a video game at work . I totally agree! If you're going to attend one data/analytics conference during the year, this is the ONE you want to go to. I was anticipating the first keynote because it always sets the stage for what is to come. Having heard Christian

The Designer Guide to Data Visualization

Image
Just came across this cool graphic from Visually : "A useful chart was put together to serve as a guide when working with data visualization. Look at it as a “What is Data Visualization?” guide.  Depending on which way you angle the infographic, you will get different results. It all depends from what angle you wish to showcase your data." Very cool. :) Explore more visuals like this one on the web's largest information design community - Visually .

Is it time for you to Sketchnote?

Image
I'm not sure why it took me so long to find it, but I just stumbled upon the book, " The Sketchnote Handbook " by Mike Rohde. It's something I've always enjoyed doing without even knowing what it was called. We've all doodled at one time or another ... most likely, when we were younger. Sketchnoting is super helpful when you're trying to jot down the big ideas instead of every detail. Plus it's fun to use images as it's something we naturally connect with more than just words. Even though I'm not a great artist by any means, I love the way Mike shows how anybody can "sketchnote"! This book is a fun read and it's very visual so you won't get bored ... I promise. :) Recently, I went to a workshop about this new data analytics platform called Paxata . It's interesting to see data preparation tools like this coming into the market. As every analyst knows, most of the time is spent cleaning up the data and preparing

Visual Literacy

Really enjoyed this video from Accenture and Al Boardman on Visual Literacy .  Visualization is becoming more and more common as people recognize the value it provides in understanding and exploring data. Check it out! Accenture - Visual Literacy from Al Boardman on Vimeo .

How To Become A GREAT Speaker

I recently came across this article from Fast Company that I converted into a slide deck. One of my favorite tools for creating visual presentations is Haiku Deck . It's important for people who work with data to be able to communicate effectively.  These tips are super helpful when you want to give a presentation that people will actually care about. Created with Haiku Deck, the free presentation app for iPad